
Sooner or later, someone in leadership looks at your podcast line item and starts asking questions.
- “Is the podcast driving leads?”
- “What’s the ROI of the show?”
- “Who’s actually listening?”
- “Are we reaching the right people?”
And to answer those questions, all you can really do is pull up the download count. Yeah… we’ve all been there.
Downloads are fine. They’re worth tracking, and they’re useful for benchmarking your show. But a download count answers exactly zero of those four questions. It tells you how many. Leadership is asking who.
That’s where three types of audience data come in: demographics, psychographics, and firmographics. Each one answers a different question about your listeners, and each one is useful for a different decision. In this guide, I’ll cover:
- What each one means in podcasting, with the data points that fall under it
- Which one matters most for your type of show (it depends, but not in a wishy-washy way)
- Where to actually get the data, including the parts no tool can hand you
- Five ways marketers put it to work, with real brand examples
What are podcast demographics, psychographics, and firmographics?
Podcast demographics, psychographics, and firmographics are three types of audience data that describe your listeners. Demographics describe who they are, psychographics describe what they care about, and firmographics describe the companies they work for.
Here’s the side-by-side before we go deeper:
| Demographics | Psychographics | Firmographics | |
|---|---|---|---|
| The question it answers | Who is listening? | Why do they listen? | Where do they work, and can they buy from us? |
| Example data points | Age, household income, family composition, location | Interests, hobbies, social media habits, values, motivations | Company name, industry, company size, revenue, job role, seniority |
| Best used for | Confirming audience fit, tone, and format | Picking topics, guests, and promotion channels | ICP validation, ABM, and tying the show to pipeline |
| Matters most to | Consumer brands | Every show | B2B brands and agencies |
1. Podcast demographics (who they are)
Demographic data points include:
- Age range
- Household income bracket
- Family composition (for example, whether listeners have kids)
- Location (country, region, city)
- Listening app and device
In a podcast context, demographics answer a basic but important question: is the show reaching the kind of person you made it for? If you built a show for early-career marketers and your median listener is 55, that’s worth knowing before you plan another season.
The limitation is just as basic. Demographics describe a person. They don’t describe a buyer. “35 to 44, household income $100K to $150K, lives in Chicago” could be a CMO or a dental hygienist, and for a B2B brand those two listeners are worth very different things.
2. Podcast psychographics (why they listen)
It helps to split psychographics into two layers, because you collect them in completely different ways:
The behavioral layer (what they do):
- Interests and hobbies (travel, cooking, reading, home and DIY)
- Social media platforms they use, and how actively
- How much social influence they carry
- Content and topic preferences
The attitudinal layer (what they believe):
- Values and priorities
- Motivations for listening (career growth, staying current, entertainment)
- Pain points and frustrations at work
- Opinions on your category
The behavioral layer can be measured in aggregate. The attitudinal layer can’t, at least not by any analytics tool I’ve seen. You get it by actually asking your audience, but more on that in the “where to find it” section.
In a podcast context, psychographics shape the creative side of your show: guest selection, episode topics, tone, and where you promote. If your listeners over-index on LinkedIn and barely touch Instagram, that’s your promotion plan written for you.
3. Podcast firmographics (where they work)
Firmographic data points include:
- Company name
- Industry
- Company size (employee count)
- Company revenue
- Company location
- Job role or function
- Seniority (C-suite, VP, Director, Manager, Individual contributor)
So instead of “a 40-year-old in Toronto,” firmographics can tell you that a VP of Finance at a mid-sized SaaS company and a Director of Legal Operations at an enterprise healthcare brand are both listening.
For B2B brands, this is the lens that matters most. It’s the only one that can tell you whether you’re reaching your ICP (ideal customer profile), which of your target accounts are tuned in, and whether the show is contributing to pipeline.
How the three work together
Demographics tell you who your listeners are. Psychographics tell you why they listen. Firmographics tell you whether they’re the right fit for your business.
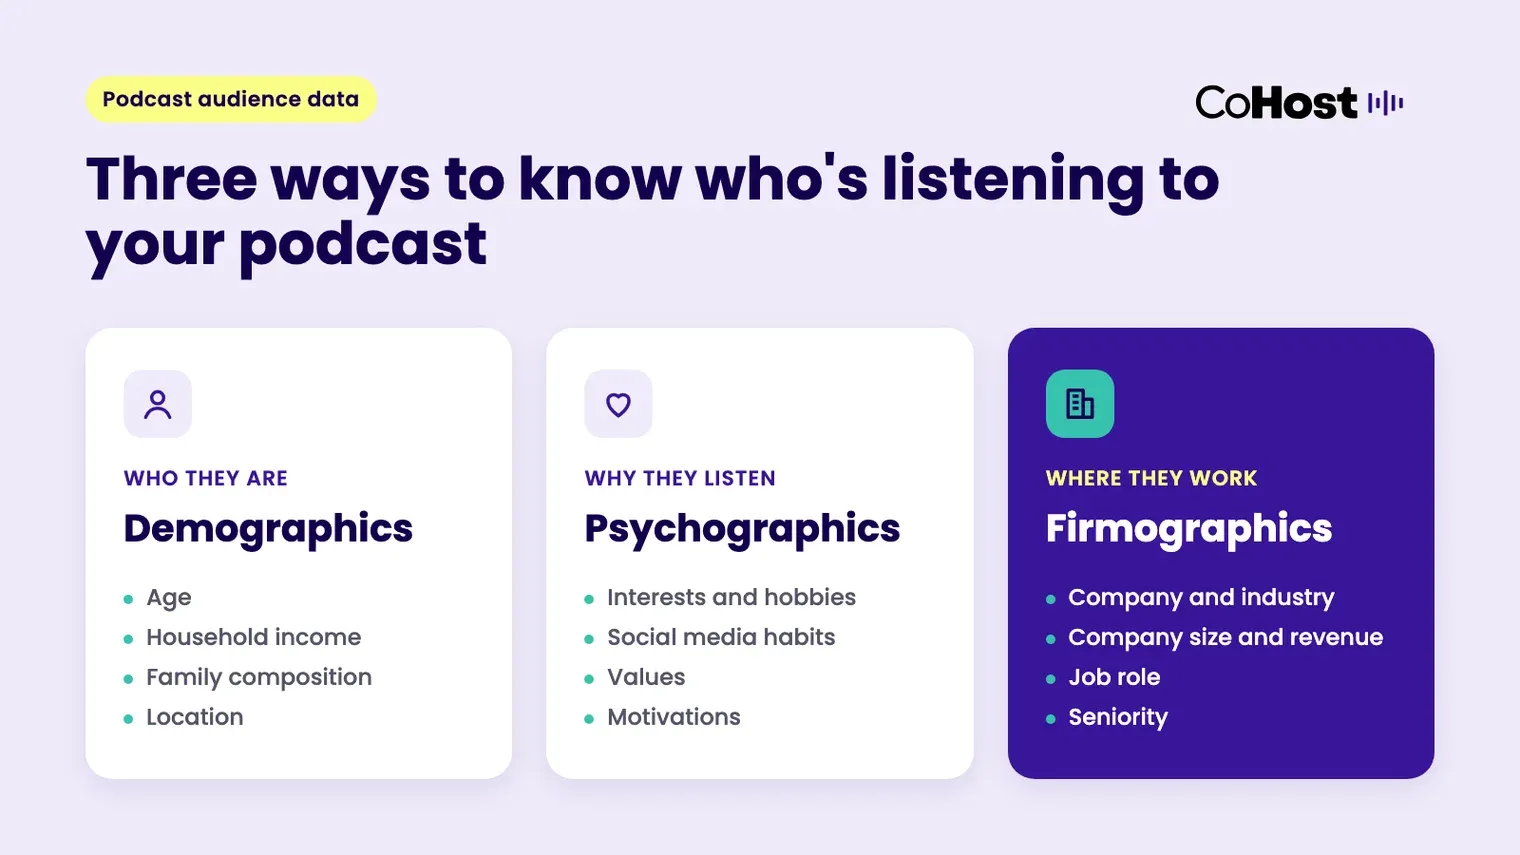
You need all three to see the full picture, but they don’t carry equal weight for every show. A show with 600 listeners who are directors and VPs at your target accounts is worth more to a B2B brand than a show with 20,000 downloads from people who will never be in a buying conversation with you. Only firmographics can tell those two shows apart. Demographics would describe both audiences in roughly the same way.
Which audience data matters most for your podcast?
It depends on what the show is for. Here’s where I’d start:
| If you are… | Lead with | Because | Use the others for |
|---|---|---|---|
| A B2B brand (SaaS, finance, healthcare, legal, professional services) | Firmographics | Leadership wants to know if the show reaches accounts that can buy | Psychographics for topics and channels; demographics for tone and format |
| A consumer brand | Demographics + psychographics | The goal is audience fit and reach, not target accounts | Firmographics to spot partnership or B2B side opportunities |
| An agency managing client shows | All three, per client | Each client’s goals differ, and renewals depend on client-ready reporting | Firmographics as the upsell story for B2B clients |
If you’re a B2B marketer and you only have attention for one of these, pick firmographics. Sorry, demographics. You’re still useful, you’re just not the answer to “is this driving pipeline?”
Why podcast audience data matters (beyond a nicer slide)
If you’ve run a branded podcast for any stretch of time, you already know that podcast data has limits. Downloads, followers, and subscribers don’t justify the cost of a show on their own. Audience data does a much better job (new listeners and consumption data help too, but that’s a whole other article).
Here’s what it gets you:
- A better content strategy. Make episodes your ideal listener actually wants, based on what they’re interested in and which episodes they finish.
- Smarter growth. Aim your growth campaigns at the job titles, industries, and interests that already engage, instead of “tech professionals, broadly.”
- Internal alignment. Sales, product, and comms teams all want to know who’s listening. Now you can tell them, in their language.
- Proof of ROI. Show leadership the show is reaching high-value segments, and connect it to accounts in your pipeline. That’s a podcast ROI conversation you can actually win.
Where to find podcast audience demographics, psychographics, and firmographics
There are three places this data comes from, and I typically see the majority of brands using a hybrid of at least two of them.
1. Listening app dashboards (free, but partial)
Spotify for Creators and Apple Podcasts Connect both give you some demographic data, like age ranges, gender, and location. It’s free and it’s a fine starting point. The catch is that each app only reports on listeners who use that app, so you’re looking at slices of your audience, one platform at a time. And neither tells you anything about the companies your listeners work for.
2. Your listeners themselves (the only source for the attitudinal layer)
Values, motivations, and pain points don’t show up in any dashboard. You have to ask. A few ways to do it without being annoying about it:
- A short listener survey promoted in your show notes and at the end of an episode. Three to five questions, max. Ask why they listen and what they want more of.
- Comments and reviews on Spotify, Apple, and YouTube. Unsolicited feedback is the most honest feedback you’ll get.
- Your sales and customer success teams, just ask them to add one question to discovery calls: “Have you listened to our podcast? What stood out?” You’ll learn more from ten of those answers than from a month of download reports.
- Your guests if they hear from their own networks after an episode drops. Ask what people said.
3. A podcast platform built for brands (cross-app demographics and firmographics)
This is where I’ll talk about us for a minute, with some context first.
Before CoHost was… CoHost, we were only Quill, our parent company and a podcast production agency. Our team kept running into the same wall with clients: we couldn’t show them who was listening, prove brand impact, or justify production budgets with anything better than downloads. The data marketers needed didn’t exist in podcasting.
So we built it.
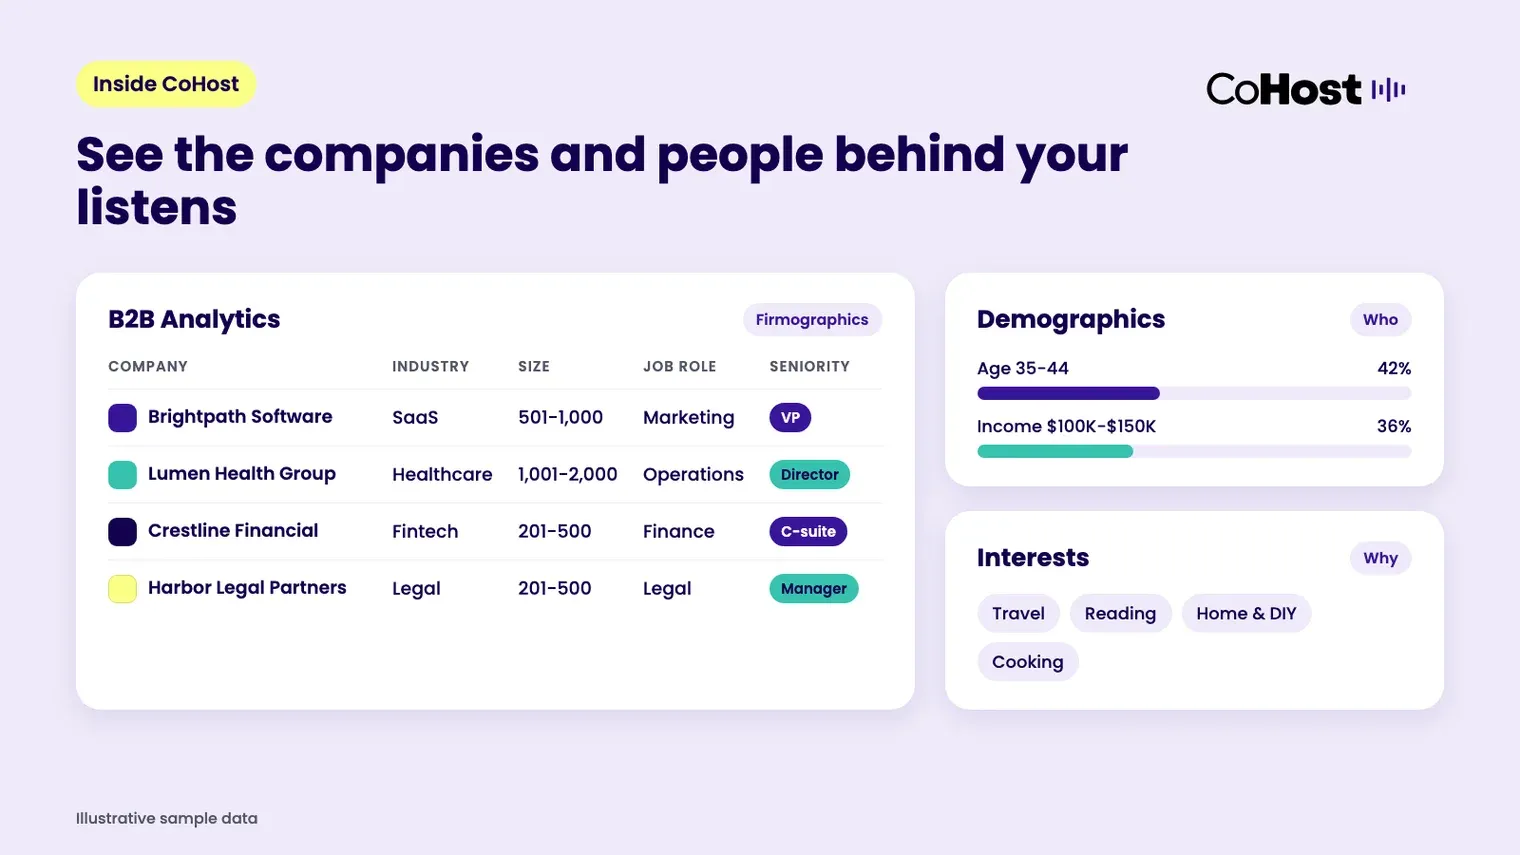
Today, CoHost is the podcast growth platform for brands that shows you which companies are listening. Here’s how that maps to the three data points:
- Demographics: Advanced Audience Demographics shows listener age, household income, family composition, and pet ownership, alongside listener location. It’s pulled from your RSS feed, so it covers every app your show is on, not one platform at a time.
- Psychographics (the behavioral layer): The same feature shows listener interests and hobbies, social media usage, and social influence. The attitudinal layer is still on you and your survey.
- Firmographics: B2B Analytics shows the companies, industries, company sizes, job roles, and seniority behind your listens. You can filter by company, role, seniority, industry, and episode, and export it to CSV.
That episode filter is the part I’d play with first. It lets you compare which types of listeners each episode attracts. Do VPs of Marketing engage more with tactical how-to episodes or big-picture trend interviews? Now you can check instead of guessing.
Five ways marketers use podcast audience data
Knowing who’s listening is step one. Here’s how B2B marketers turn it into decisions, with real examples from brands using CoHost.
1. Aim growth campaigns at the right listeners (firmographics)
Scenario: You’re launching a paid growth campaign to promote your branded podcast on LinkedIn and across podcast listening apps.
How audience data helps: Let’s say your data shows that most of your current listeners work in SaaS, and the biggest group is product managers at companies with 200 to 500 employees (hypothetical numbers, but a very typical pattern). Instead of targeting “tech professionals,” you target those job titles, industries, and company sizes. And after the campaign runs, you check the firmographics again to see if the new listeners actually match.
That means less wasted ad spend, more qualified listeners, and a show that lines up with your ABM and demand gen plans.
In practice: Russell Reynolds Associates wanted to grow Redefiners while making sure it reached senior leaders and C-suite executives. CoHost’s Audience Growth Services ran custom paid campaigns across Apple, Spotify, YouTube, and other platforms, and B2B Analytics validated that the new listeners were the decision-makers they were after. The show saw a 300%+ increase in its average seasonal growth rate and ranked #1 in the Careers category.
2. Plan episodes around who’s actually listening (all three)
Scenario: You’re planning next season and you’re not sure which themes will land.
How audience data helps: Let’s say your data shows listeners over-index on interests like entrepreneurship and travel, most are 25 to 34, and the biggest firmographic group is marketers at mid-market tech companies. That points you toward:
- More founder and operator guests alongside the big-name execs
- A short mini-series on how AI is changing marketing roles
- A looser, faster format to match a younger, early-career audience
In practice: Procore used CoHost’s firmographic, demographic, and consumption data on The Power of Construction and found the show reached construction professionals from the field all the way to the C-suite. They also saw content spreading inside organizations, from C-suite listeners out to VPs, directors, and managers, plus growing listenership in markets like Canada and Australia. That’s the kind of detail that shapes who you book and what you cover next.
3. Support ABM and see which target accounts are listening (firmographics + Salesforce)
Scenario: Your sales team has a list of 100 target accounts they’re focused on this quarter.
How audience data helps: With firmographic data, you can see how many of those accounts have listeners, and which listening companies look like your target accounts even if they’re not on the list yet.
If your target accounts aren’t showing up, that’s a signal to adjust:
- Distribution, like paid promotion aimed at that vertical
- Episode themes that speak to that industry’s pain points
- Guests, like inviting execs from those accounts (nothing builds affinity like being on the show)
Then get the data to the people who can act on it. With CoHost’s Salesforce integration, listener firmographics sync straight into Salesforce on a daily, weekly, or monthly schedule, so your sales team sees podcast engagement in the account record instead of waiting on a CSV from you. It syncs three things:
- Firmographics (company, industry, size, revenue, location, job role, seniority)
- Show analytics (downloads and unique listeners per episode)
- Episode consumption
When you report on it, split the accounts into two lines:
- Net-new companies: Pipeline the show sourced
- Companies already in your CRM: Pipeline the show is influencing
Both count and are important to showcase. An open opportunity that listens to three episodes during the sales cycle is the show doing its job.
In practice: impact.com used B2B Analytics, Advanced Audience Demographics, and tracking links on The Partnership Economy to confirm the show was reaching partnership marketers and decision-makers, and to connect podcast engagement to pipeline. The show grew to 100,000+ target listeners in its niche and climbed the Business podcast charts.
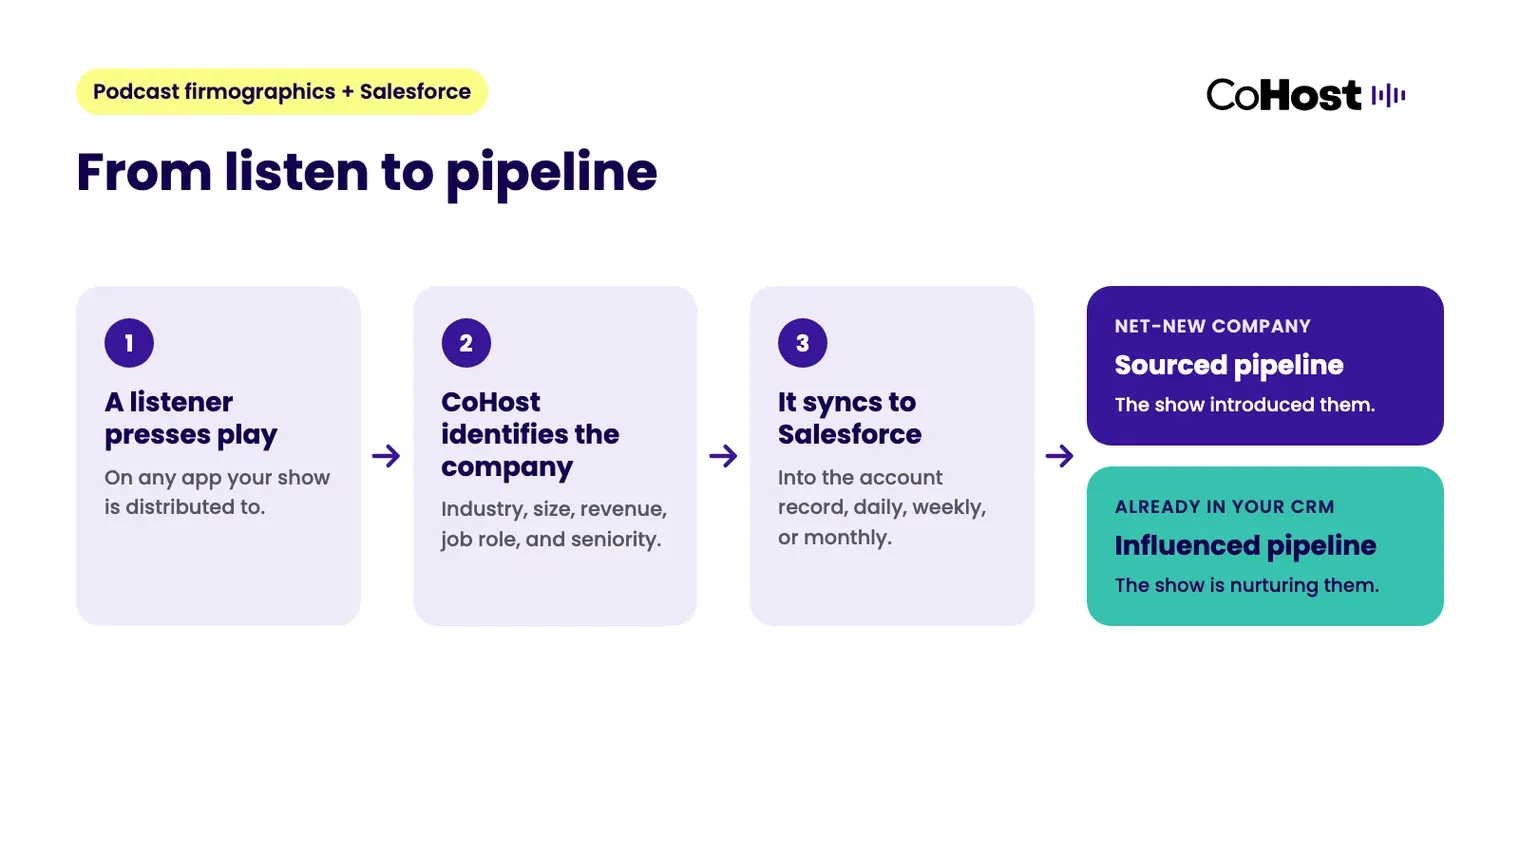
The Salesforce integration is available on CoHost’s Premium and Enterprise plans for shows hosted on CoHost. Learn more about CoHost plans.
4. Pick the channels that actually work (demographics + psychographics)
Scenario: You’re promoting every episode everywhere and you have no idea which channel is pulling its weight.
How audience data helps: Social media habits and demographic data tell you where your listeners already spend time. Pair that with tracking links on each channel and you’ll know which promotion is driving listens, so you can put more behind it and stop feeding the rest.
In practice: Yelp could see how many people were listening to Behind the Review, but not who. With CoHost layered on top of their existing host (no migration), they found a strong base of small business owners and operators, and identified LinkedIn as a high-performing channel. They used it to sharpen their marketing channels and line up content with the listeners they actually had.
5. Land better guests (firmographics + psychographics)
Scenario: You’re sourcing guests for a new series and want people who add credibility and help with discoverability.
How audience data helps: Let’s say your data shows your listeners are B2B marketing leaders who care about customer retention and RevOps. You can:
- Invite guests who match that expertise, like a CMO at a retention-focused SaaS brand
- Pitch guests with proof that their own target audience is already listening (a much easier yes)
- Mirror your listeners’ interests in outreach: “Our listeners are marketing and RevOps leaders at mid-market SaaS companies”
Three mistakes to avoid with podcast audience data
Treating aggregate data like a person. Demographic and interest data describes the shape of your audience, not any individual listener. “Our audience skews 35 to 44” is a finding. “Our listener is a 38-year-old named Dave” is a persona you made up.
Chasing a bigger number instead of a better one. If a growth campaign doubles your downloads but the new listeners don’t match your ICP, you’ve bought a nicer-looking chart. After every campaign, check the firmographics before you celebrate the download count.
Reporting the data without a decision attached. “Here’s who’s listening” is interesting for about one meeting. “Here’s who’s listening, so we’re booking two guests from this industry and moving budget to LinkedIn” is what gets next season approved.
Your podcast already has an audience. Now get to know it.
Demographics, psychographics, and firmographics take your podcast reporting past the download count and into something you can actually make decisions with (music to a marketer’s ears).
Together, they show you:
- Who is listening
- Why they tune in
- Whether they’re the right audience for your business
Here’s the part I’d hold onto. Most brands still walk into the budget meeting with a download count and a hopeful face. So to put it bluntly, the bar is low. The marketers who show up knowing which companies are listening, and what those listeners care about, won’t be defending their podcast next year, they’ll be growing it.
Want to see which companies are listening to your show? Book a demo and we’ll walk you through it.
