

Apple hands you a free analytics dashboard the moment your show goes live. Plays, listeners, engaged listeners, average consumption, followers, and time listened. It is genuinely good data. Most brands read about 10% of it, then return to bragging about download counts.
I encourage you not to be one of those brands.
The Apple Podcast dashboard tells you whether people actually listened, not just whether a file was downloaded to a phone. That one distinction makes a surprisingly huge difference, because as we've been shouting from the rooftops, brands need to move away from how many people are listening and into how engaged they were and who is listening.
So, to summarize, there's genuinely helpful data on how engaged your audience is with your podcast sitting inside your Apple Podcasts Connect dashboard.
This guide breaks down every metric in Apple Podcast analytics, including:
- What each one means
- What brands and marketers should actually do with it
We'll also cover the one question Apple will never answer for you. Spoiler: We mentioned it above, and it's the question your CMO keeps asking 👀.
TL;DR: How to read Apple Podcast analytics
- Access for free: Apple Podcast analytics lives inside Apple Podcasts Connect and is free for anyone who publishes a show.
- Plays are not downloads: A download is a file transfer. A play is a human pressing play.
- Available analytics: Plays, Listeners (unique people), Engaged Listeners (20 minutes or 40% of an episode), Average Consumption, Followers, and Time Listened.
- The metrics that matter: Engaged Listeners and Average Consumption are the two metrics that tell you whether your content is working.
- What Apple lacks: Apple tells you where people listen (country, region, city) and how engaged they are. It never tells you who they are. No company names, no job titles, no industries. No way to tie the podcast back to pipeline.
- The podcast analytics B2B brands need: For B2B brands, that "who" gap is what brings business impact and pipeline attribution into the conversation.
What is Apple Podcast analytics?
Apple Podcast analytics is the free measurement dashboard inside Apple Podcasts Connect that shows how people find, play, and engage with your show on Apple Podcasts. It reports plays, unique listeners, engaged listeners, average consumption, followers, time listened, and listener location.
In plain terms, it tells you whether people pressed play, how many of them were real humans, how much of each episode they got through, and roughly where geographically they were listening.
One catch worth knowing up front. Apple only shows listener data once at least five unique listeners have played your content in the selected window. Fewer than five, and you get a blank space.
The Apple Podcast metrics that actually matter
Through the dashboard, Apple gives you a pile of numbers and metrics to sift through. Here's what each one means, and what to do with them instead of just throwing them into a report that generates zero impact.
Plays
What Apple counts: The total number of times people pressed play on your episode. It only counts once playback passes zero seconds.
This is the metric that should replace "downloads" in your reporting, and it's the upgrade most brands haven't made yet. A download means a file moved to a device, often automatically. Your phone downloading an episode doesn't result in someone actually listening to the show. A play means a person has made a decision.
Listeners
What Apple counts: The total number of people who listened to or watched your show (yes, "watched." Apple now folds video podcasts into the same dashboard).
Listeners strip out the inflation. One person who plays five episodes is five plays, but one listener. If you want to know how big your actual audience is rather than how busy it is, this is your number.
Engaged Listeners
What Apple counts: The number of people who listened to or watched at least 20 minutes or 40% of an episode, whichever comes first.
This is the most underused metric in the entire dashboard. Anyone can rack up plays with a good title and a thumbnail. Engaged Listeners is the count of people who actually stuck around. If your plays are climbing but your engaged listeners are flat, you don't have a growth problem; you have a content problem.
Average Consumption
What Apple counts: A percent average of how much of an episode people played per device, based on listener behavior and episode length. Above 100% means people re-listened to parts of the episode.
Average Consumption is the metric that tells you things like where listeners bail in the episode. Maybe your intro is too long, maybe the episode format isn't resonating, or maybe the guest runs on for too long in a segment.
Followers
What Apple counts: The total number of people following your show on Apple Podcasts.
Apple lets you watch followers as a trend and compare how followers behave versus non-followers. For brands, followers are the closest thing Apple gives you to an owned audience, so treat the follower line like a subscriber list.
Time Listened
What Apple counts: The cumulative total of time listened across all listeners and followers, viewable as a trend over a date range.
Time Listened is total attention, in hours. It's the number that reframes a "small" podcast for a skeptical executive. Two hundred listeners finishing a 30-minute episode is a hundred hours of undivided attention from your exact target audience. Try buying that much focused attention on LinkedIn and see what it costs, okay?
Top Countries, Regions, and Cities
What Apple counts: The total number of unique devices per country, region, and city.
This is where Apple's location data both helps and teases you. It's legitimately useful for spotting where your audience clusters, planning live events, or sanity-checking that your "global" show isn't actually 90% one metro. It's also the closest Apple ever gets to telling you who's listening, and it stops there... but hold that thought.
How to read Apple Podcast metrics like a marketer
I think the most helpful way to break out Apple Podcast metrics and how to think about them is to compare the marketer view versus a more vanity-focused view. And what I mean by vanity view is that you're taking the metric at face value rather than asking, "So what?"
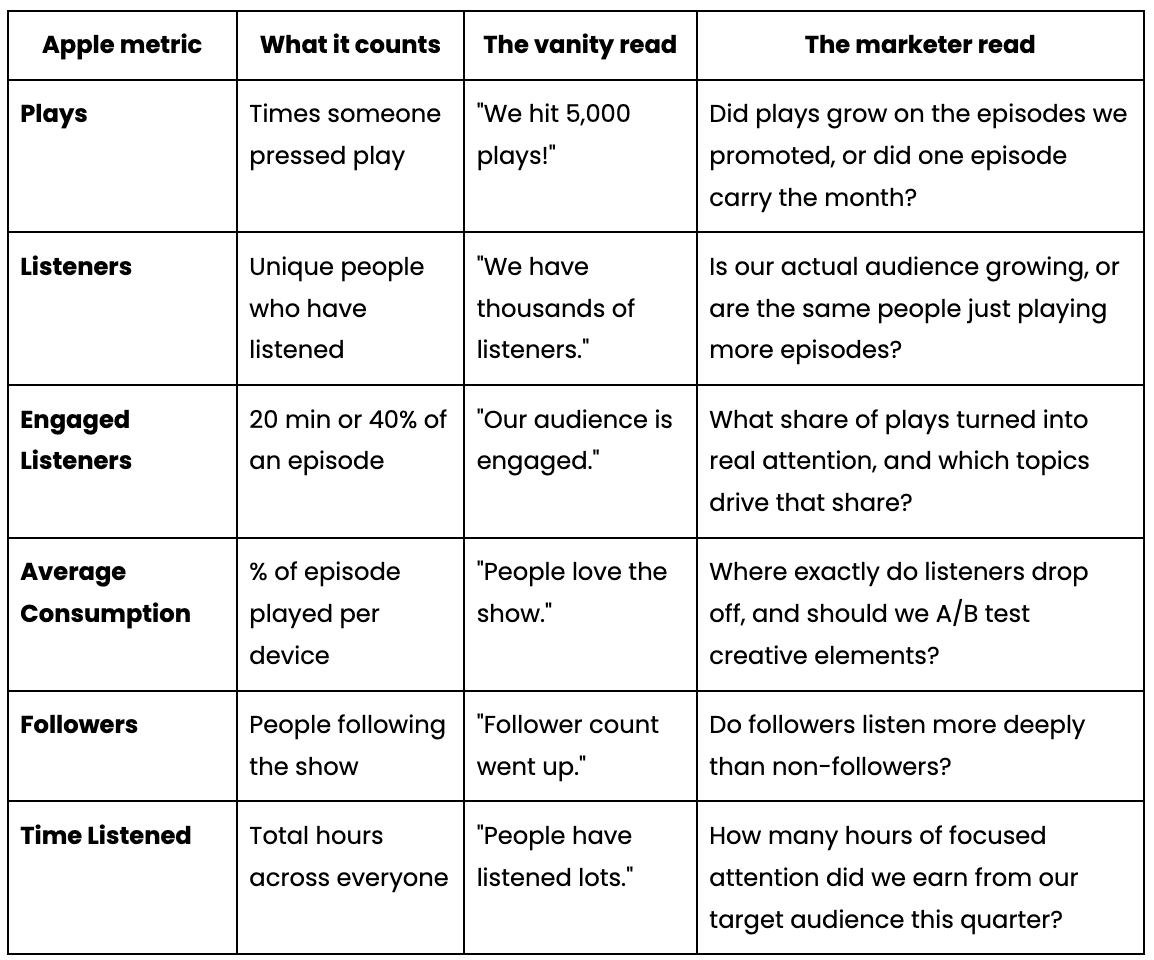
If you walk into your next reporting meeting with the right column instead of the left, you'll have a much easier time justifying podcasting budgets.
Where Apple Podcast analytics stops: The "who" problem
Here's the wall every brand eventually hits.
Apple Podcast analytics can tell you that 1,200 people in Chicago played your latest episode and that 58% of them finished it. That's great.
It cannot tell you that one of those people is the VP of Demand Generation at an account your sales team has been chasing for six months.
Apple's data is built around devices and locations, not people and companies. That's a reasonable design choice for a distribution platform serving millions of shows. It's also a hard ceiling for a B2B brand trying to prove its podcast reaches decision-makers, not just downloads.
A consumer podcast selling attention can live inside Apple's dashboard happily. A B2B podcast selling trust to a specific buyer cannot. The questions your leadership asks are "which companies are listening?" and "are any of them in our pipeline?" Apple will never answer either, because it was never built to.
That's not a knock on Apple. It's just the line where free platform analytics end and audience intelligence begins.
"Apple Podcasts Connect is a great free dataset for podcasters. Plays, engaged listeners, average consumption, it tells you whether people actually listened, not just whether they downloaded an episode. But for brands, these metrics frankly aren't enough to justify a podcast to leadership. Understanding who is actually listening to your podcast is the connection brands need between the show and business impact. Downloads and engagement alone just don't cut it anymore."
Sariann Afghan, Product Manager & Designer at CoHost
That last point is the one that matters most, and it's the whole reason CoHost exists. Apple shows you the listen. We show you the listener. Equipped with that level of insight, the podcast becomes a conversation about pipeline and business impact instead of vanity metrics like downloads.
How to consolidate Apple Podcast analytics across listening apps
Apple Podcast analytics is Apple-only. Let me break it down:
Apple Podcasts is a listening app, so its dashboard only shows you what happened on Apple. Spotify shows you Spotify. Overcast shows you Overcast. Your audience is spread across a dozen apps, and not one of them shows you the whole picture.
This is exactly what your podcast hosting platform is for. Your podcast host is the home base for your podcast. You upload your audio file to the platform, and it distributes your show to all of the various listening apps, which means it tracks every play and download request.
So while Apple can only see Apple, your podcast host can see all of it, broken down by app, in one consolidated tool.
And we have to add that most podcast hosts can consolidate the how much and the where. The part almost none of them show you is exactly what I've already mentioned... say it with me... the who. We built our B2B Analytics to answer that exact question. Explore the companies, industries, job roles, and seniority of your listeners and sync that data with your CRM and pipeline.
FAQ
What is Apple Podcast analytics?
Apple Podcast analytics is the free measurement dashboard inside Apple Podcasts Connect. It reports plays, unique listeners, engaged listeners, average consumption, followers, time listened, and listener location for any show published on Apple Podcasts, with a default window of the last 60 days compared to the prior period.
What's the difference between plays and downloads on Apple Podcasts?
A download is a file transferred to a device, which often happens automatically and doesn't mean anyone listened. A play is counted when a person actually presses play and playback passes zero seconds. Plays are the more honest engagement signal, which is why Apple foregrounds them and why brands should report plays instead of downloads.
What does "engaged listeners" mean on Apple Podcasts?
Engaged Listeners is Apple's count of people who listened to or watched at least 20 minutes or 40% of an episode, whichever comes first. It measures meaningful consumption rather than a quick sample, so it's one of the best indicators of whether your content is actually holding attention.
What is a good average consumption rate on Apple Podcasts?
There's no universal "good" number because it depends on episode length and format, but most shows should aim to keep average consumption high enough that listeners reach the core of the episode. The more useful move is to track where consumption drops within each episode and fix the spots where people leave. A value above 100% means people re-listened to parts of the episode.
Can Apple Podcast analytics tell me which companies are listening?
No. Apple reports listener location (country, region, and city) based on unique devices, but it does not provide company names, job titles, or industries. To see which companies and roles are listening, you need an audience-intelligence layer like CoHost's B2B Analytics, which identifies the companies, industries, and job seniority behind your listens.
Why don't my Apple Podcast numbers match my hosting platform?
Different platforms count differently. Apple measures plays and engaged listeners on Apple Podcasts specifically, while your host typically measures downloads or requests across every app. The methodologies, time zones, and de-duplication rules differ, so the numbers rarely line up exactly. Use Apple's data for engagement quality on Apple, and your host's analytics for cross-platform totals.
How often does Apple Podcast analytics update, and how far back does it go?
Apple's dashboard updates regularly and defaults to the last 60 days compared against the preceding period, with the ability to change the date range. Note that listener data only appears once at least five unique listeners have played your content within the selected window.
Do Apple Podcast analytics include video podcasts?
Yes. Apple now reports on shows that are watched as well as listened to, so the listeners and engaged listeners metrics fold in video playback where applicable. The core definitions stay the same whether your audience is listening or watching.
Should I report plays or downloads to my leadership team?
Report plays. Downloads inflate your numbers with automatic file transfers that never become a listen. Plays reflect actual human action, and pairing them with engaged listeners and average consumption gives leadership a far more accurate picture of whether the podcast is working.
Don't stop at Apple Podcast analytics
Apple Podcast analytics is a genuinely good free tool. Start by reading the metrics that matter (plays, engaged listeners, average consumption, followers, time listened) instead of the download count that's been quietly lying to you (sorry). That alone will make your next reporting meeting sharper.
Then be honest about where Apple's data ceiling is. It tells you how many people listen and roughly where they are. But it won't answer key questions your leadership is asking, like who they are or where they work. For a B2B brand, that's the answer that turns a podcast from a content line item into a pipeline source.
And as I've mentioned, that's the part CoHost was built for. See the companies, industries, and roles behind your listens, right next to the cross-app engagement data you're already tracking.
Want to see who's actually listening to your show? Book a demo to walk through B2B Analytics with our team.